

Nursing regression analysis in SPSS can examine how several variables relate to a dissertation outcome, but the model must be built from a defensible nursing question. Adding every available variable does not produce a stronger study; it may create unstable estimates and confusing conclusions.
This guide explains when regression fits nursing research, how to choose the model, prepare predictors, check assumptions and interpret coefficients without claiming more than the design can establish.
When Nursing Regression Analysis in SPSS Fits
Regression may be appropriate when a nursing dissertation asks whether one or more predictors are associated with an outcome, whether an association remains after accounting for specified variables, or how well a defined set predicts an outcome.
Examples include examining factors associated with a continuous confidence score or estimating the probability of a binary clinical outcome. Regression does not automatically establish causation, especially in observational or cross-sectional studies.
Choose the Regression Model From the Nursing Outcome
- Linear regression: commonly used for a continuous outcome when model requirements are reasonably satisfied.
- Binary logistic regression: appropriate when the nursing outcome has two categories.
- Other models: may be required for ordinal, count, repeated or time-to-event outcomes.
Do not select linear regression merely because it is familiar. The outcome structure and research purpose determine the model family.
Build the Nursing Model Deliberately
Predictors should come from the research question, theory, previous nursing evidence and analysis plan. Distinguish the primary exposure, possible confounders, mediators and variables included for prediction. These roles affect what an adjusted coefficient means.
Avoid choosing variables solely because preliminary p-values cross a threshold. Automated selection may produce a model that is difficult to reproduce or justify clinically.
Prepare Variables for Nursing Regression Analysis in SPSS
Check coding, missing data and reference categories before modelling. Categorical predictors may require indicator coding, and the reference group determines the interpretation. Continuous predictors need meaningful units; rescaling may make coefficients easier to explain.
Confirm that higher and lower values of every nursing scale have the expected meaning. An incorrectly reversed score can change the direction of an association.
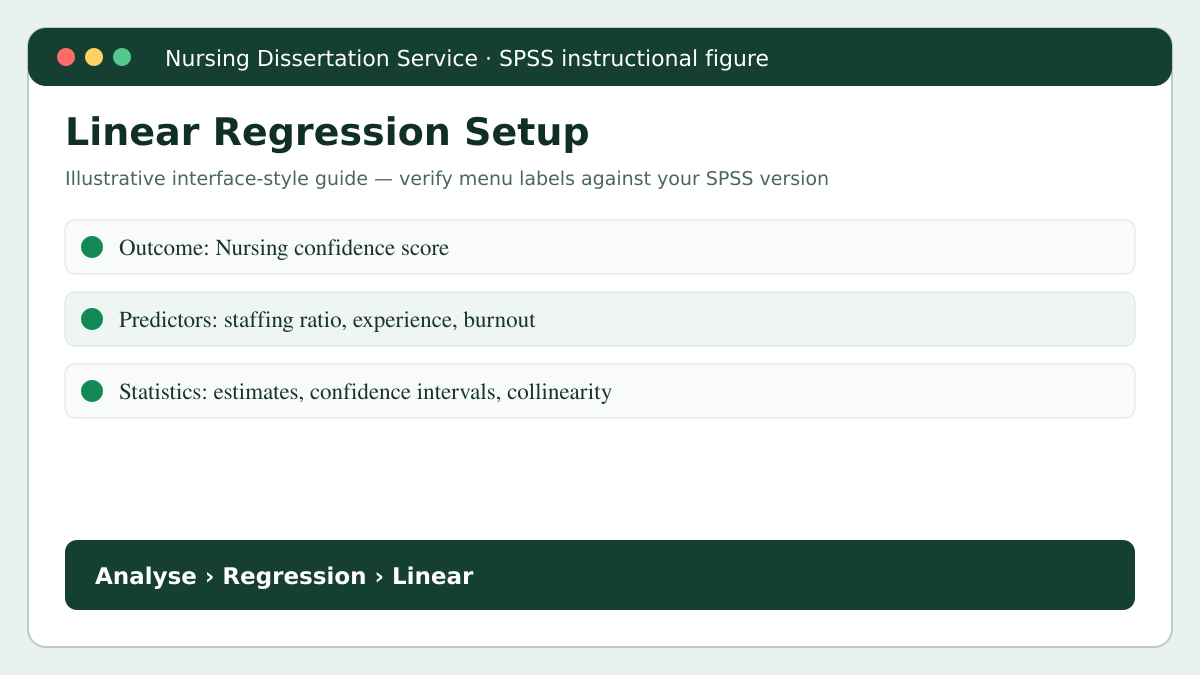
Before running the model: Confirm the outcome, predictors, coding decisions and entry method from the nursing research question. Request the relevant residual, collinearity and influence diagnostics so the analysis can assess model requirements rather than reporting coefficients alone.
Check Linear Regression Requirements
Relevant considerations include linear relationships, independence of errors, reasonably constant residual variance, suitable residual behaviour, absence of severe multicollinearity, influential observations and adequate information for the number of estimated parameters.
Diagnostics should support a reasoned decision. Removing an observation simply because it changes statistical significance is not defensible.

What to read in the output: Use R² and adjusted R² to describe explained variation, the ANOVA table to assess the overall model, and the coefficients table to interpret each predictor. Report B, its confidence interval and p-value while also checking collinearity and the direction of the association.
Interpret Linear Regression Output
An unstandardised coefficient represents the expected change in the nursing outcome for a one-unit increase in the predictor while holding the other included predictors constant. Report the confidence interval to show uncertainty.
Standardised coefficients may help compare predictors measured on different scales, but they do not automatically show clinical importance. R-squared describes the proportion of sample outcome variability accounted for by the included predictors; it does not prove that the model is true.
Interpret Logistic Regression Output
Logistic regression coefficients are commonly exponentiated to produce odds ratios. An odds ratio above one indicates higher odds relative to the stated unit or reference category; below one indicates lower odds. Always identify the reference group and report the confidence interval.
Do not describe an odds ratio as a risk ratio unless the analysis genuinely estimated risk. The difference can be important when outcomes are common.
Adjusted Nursing Associations Are Not Automatically Causal
An adjusted association accounts only for variables included and represented appropriately in the model. Residual confounding, measurement error, reverse direction and selection processes may remain. Interpretation must reflect the nursing study design and data quality.
Report Nursing Regression Results Clearly
| Reporting element | What to state |
|---|---|
| Model purpose | Nursing outcome and research question |
| Analytical sample | Cases included and missing-data handling |
| Predictor coding | Units and reference categories |
| Model findings | Coefficients or odds ratios with intervals |
| Model performance | Relevant fit or explained-variance measures |
| Diagnostics | Checks that influenced the decision |
| Conclusion | Restrained nursing interpretation |
A concise coefficient table is usually clearer than pasted SPSS output. Ensure every number in the narrative matches the table.
Common Nursing Regression Errors
- Using the wrong model for the outcome.
- Including too many predictors for the available information.
- Interpreting association as causation.
- Ignoring reference categories.
- Confusing odds with probability.
- Reporting only p-values.
- Removing cases without a transparent rule.
- Overlooking multicollinearity or influential observations.
Regression in Mixed-Methods Nursing Research
Regression can analyse the quantitative strand of a mixed-methods dissertation. Qualitative interviews may explain experiences or contexts not captured by the model. Integration should compare or connect the findings explicitly; interview quotations should not be treated as statistical confirmation.
Frequently Asked Questions
How many predictors can a nursing regression include?
There is no universal number. It depends on available information, outcome distribution, model complexity and intended inference.
Should every demographic variable be included?
No. Include variables according to the question, theory, evidence and analysis plan. Unnecessary adjustment can reduce precision or change interpretation.
Can significant regression prove an intervention works?
No. Causal interpretation depends on design, comparison, measurement, bias control and assumptions—not statistical significance alone.
Get Nursing Regression Support
Our nursing dissertation data analysis service can review outcome selection, predictor coding, SPSS diagnostics, coefficients and dissertation interpretation.
Worked Nursing Regression Example
Suppose a cross-sectional nursing study examines whether staffing ratio, years of experience and burnout predict a continuous professional-confidence score among 180 registered nurses. In SPSS, open Analyse > Regression > Linear, place confidence score in the dependent box and enter the three prespecified predictors. Request estimates, 95% confidence intervals, collinearity diagnostics and residual plots. IBM explains that linear regression requires attention to the distribution of the outcome at predictor values and the behaviour of residual variance; its documentation should be checked against the installed SPSS version (IBM, n.d.-a).
A dissertation should report the overall model before individual predictors. For example: “The model explained 28% of variation in professional confidence, adjusted R² = .26, F(3, 176) = 22.81, p < .001. Higher burnout was associated with lower confidence, B = −0.31, 95% CI [−0.47, −0.15], p < .001, after adjustment for staffing ratio and experience.” These values are illustrative and must be replaced with the student’s own verified output.
Evidence-Based Regression Reporting Checklist
- State whether the outcome required linear, logistic or another regression family. IBM notes that logistic coefficients can be used to estimate odds ratios for binary outcomes (IBM, n.d.-b).
- Explain why each adjustment variable was included rather than relying only on preliminary p-values.
- Report sample size, missing data, unadjusted and adjusted estimates, 95% confidence intervals and model diagnostics.
- Keep association separate from causation when the design is observational.
The STROBE Statement recommends transparent reporting of statistical methods, handling of quantitative variables and missing data, and adjusted estimates with their precision (von Elm et al., 2007). The SAMPL guidelines similarly recommend reporting estimates and confidence intervals, not significance alone (Lang & Altman, 2015).
Related Nursing Guides
- Nursing Likert-Scale Data in SPSS: Analysis Guide
- A Priori vs Post Hoc Power Analysis in Nursing
- Effect Size for Nursing Research: SPSS and G*Power Guide
Conclusion
Nursing regression analysis in SPSS should connect a clinically meaningful question to an appropriate model, justified predictors, verified diagnostics and cautious interpretation.
References
- IBM. (n.d.-a). Linear regression. IBM SPSS Statistics Documentation. https://www.ibm.com/docs/en/spss-statistics/32.0.0?topic=features-linear-regression
- IBM. (n.d.-b). Logistic regression. IBM SPSS Statistics Documentation. https://www.ibm.com/docs/en/spss-statistics/31.0.0?topic=regression-logistic
- Lang, T. A., & Altman, D. G. (2015). Basic statistical reporting for articles published in biomedical journals: The “Statistical Analyses and Methods in the Published Literature” or the SAMPL Guidelines. International Journal of Nursing Studies, 52, 5–9. https://doi.org/10.1016/j.ijnurstu.2014.09.006
- von Elm, E., Altman, D. G., Egger, M., Pocock, S. J., Gøtzsche, P. C., & Vandenbroucke, J. P. (2007). The Strengthening the Reporting of Observational Studies in Epidemiology (STROBE) statement: Guidelines for reporting observational studies. PLoS Medicine, 4(10), e296. https://doi.org/10.1371/journal.pmed.0040296


